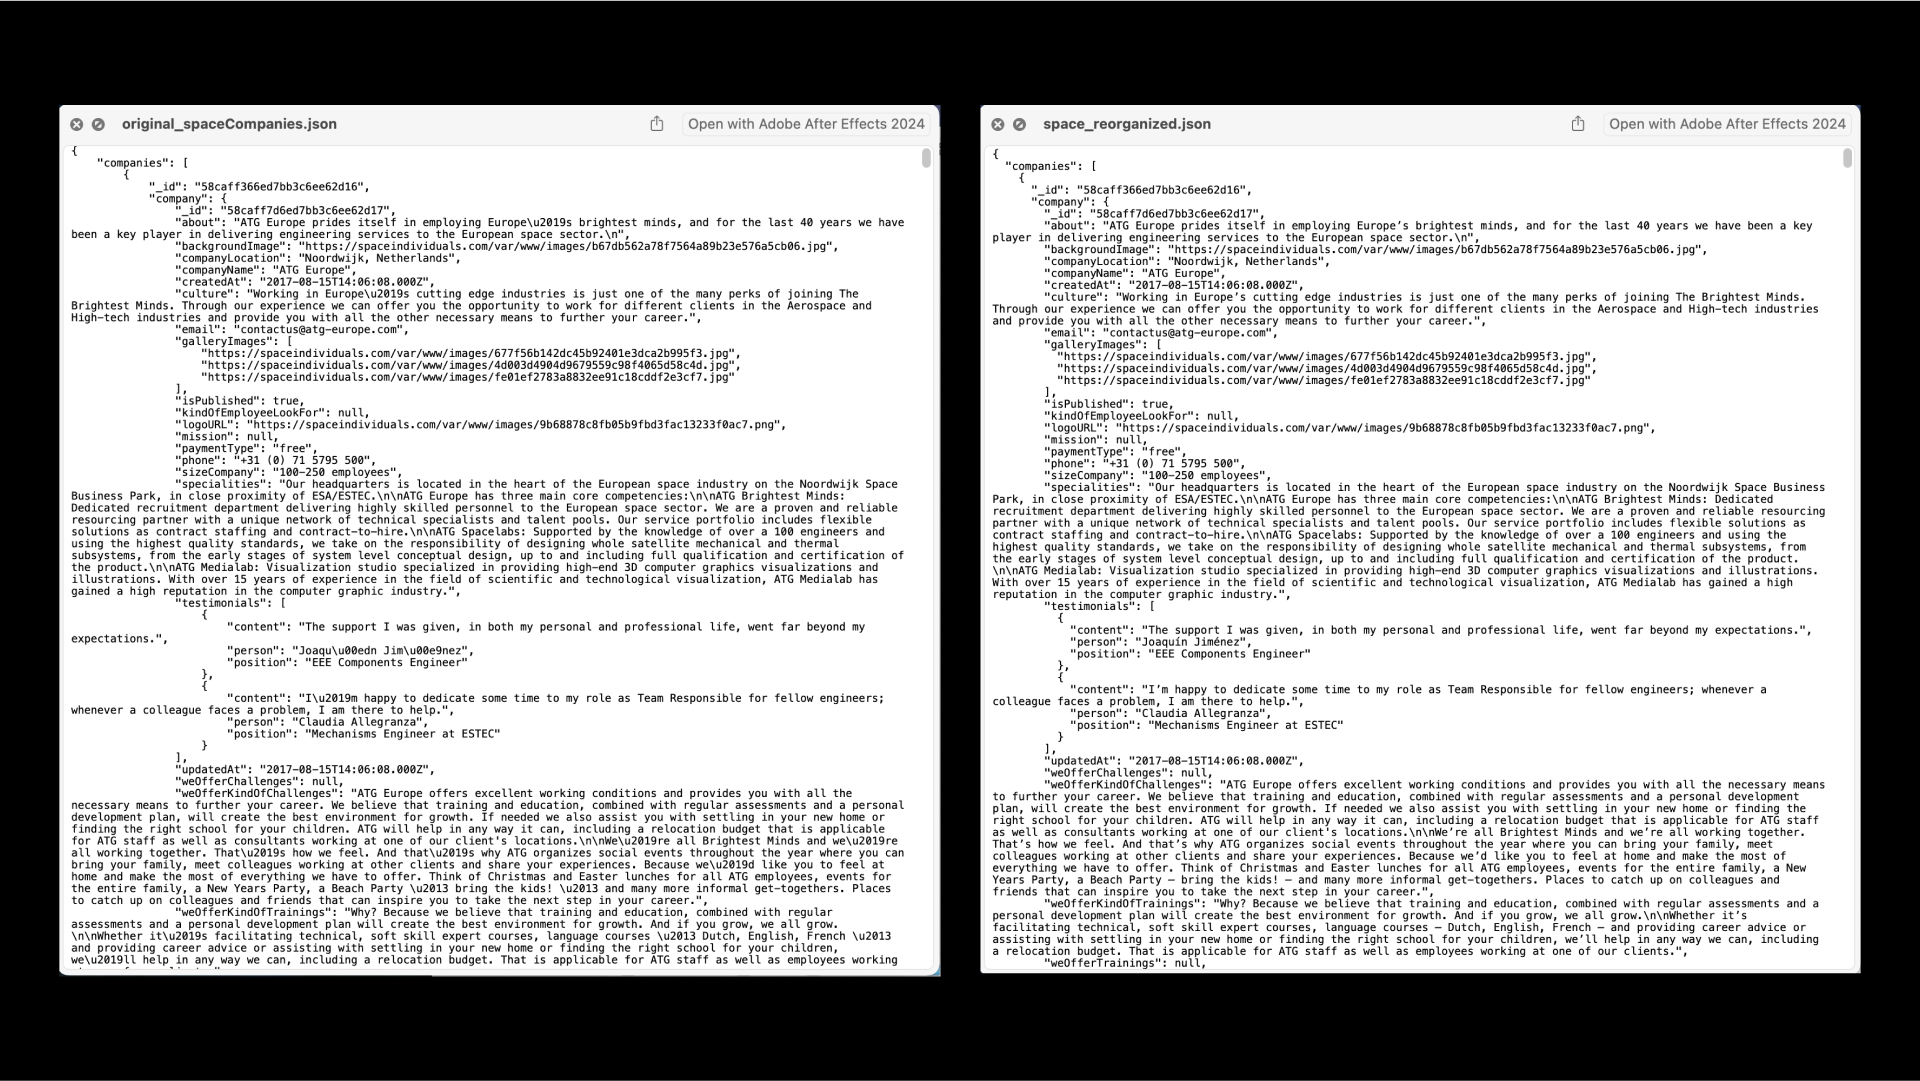
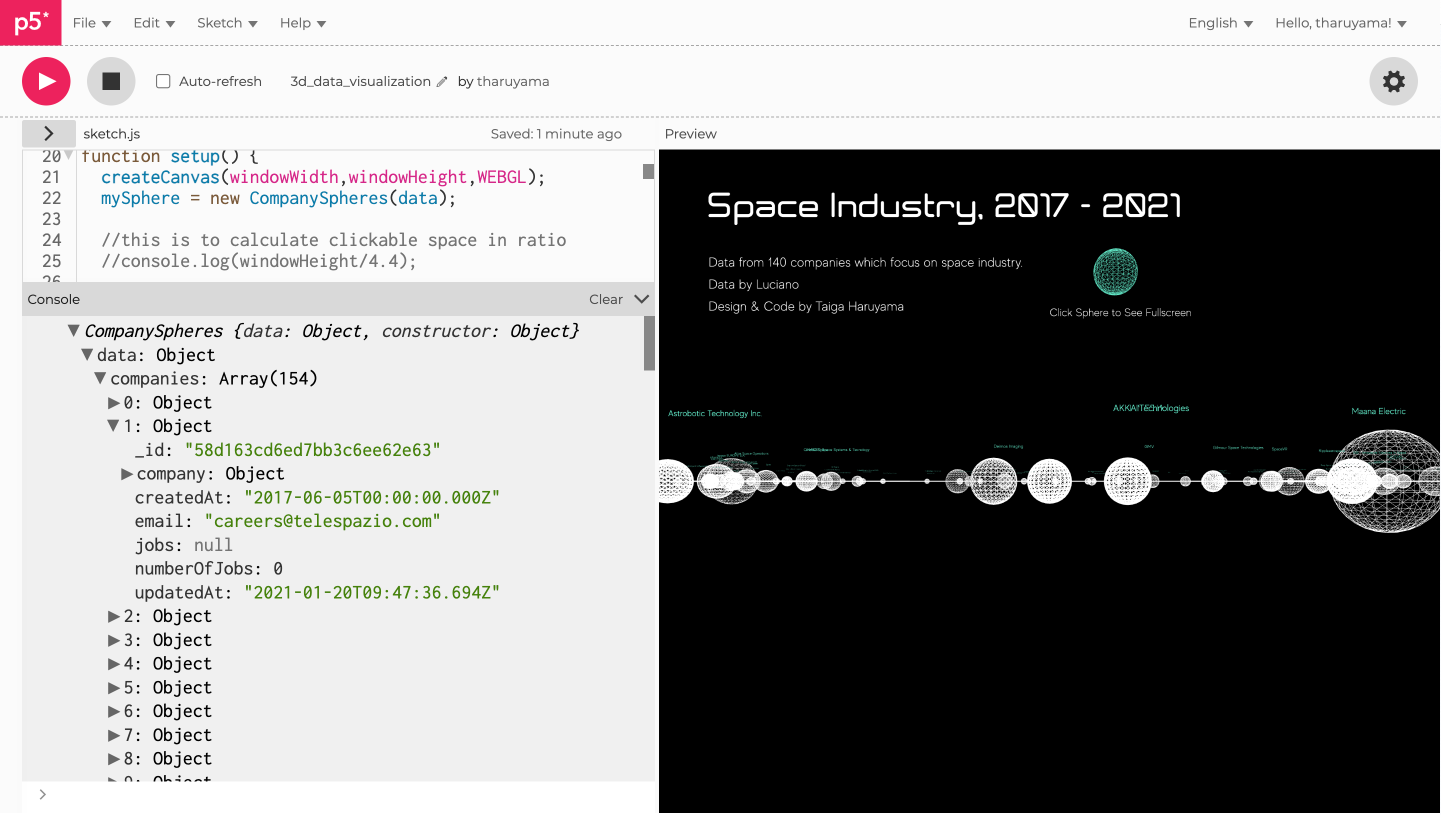
Using json data sheets, I created an interactive 3D data visualization on p5.js, The data was about companies in space industry. The size of each sphere represents the number of employees at a company, while the distance of each sphere from the center point indicates its year of establishment, ranging from 2017 to 2021.