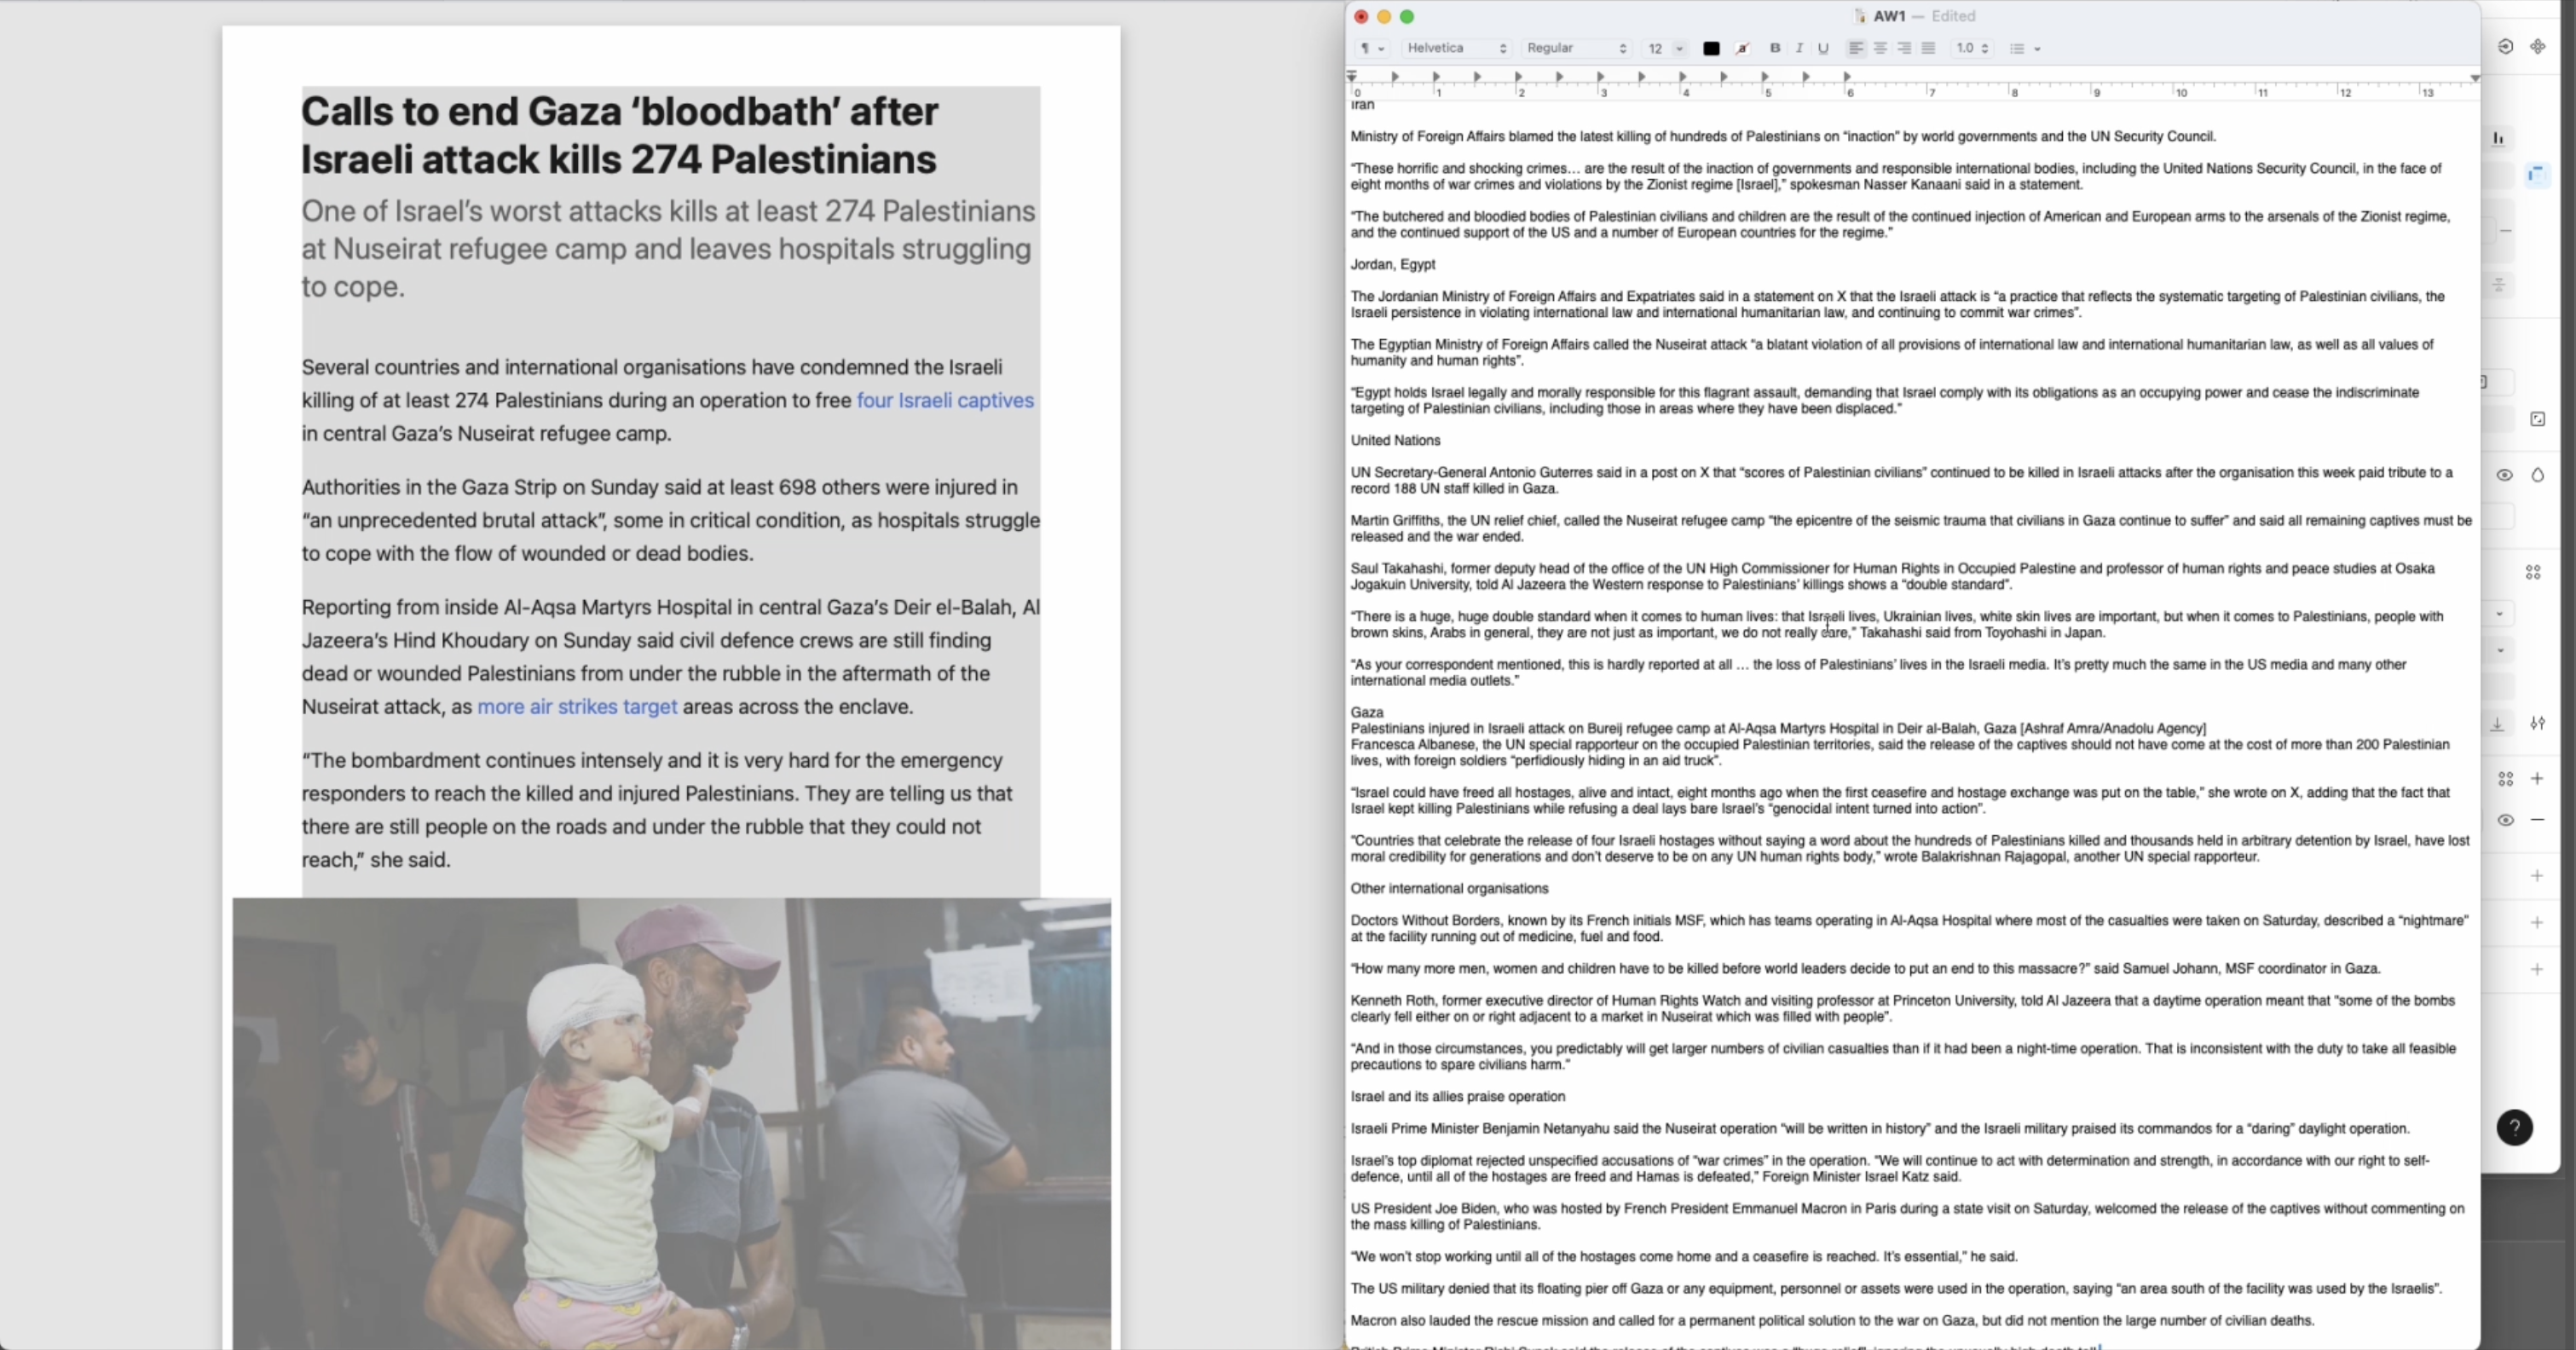
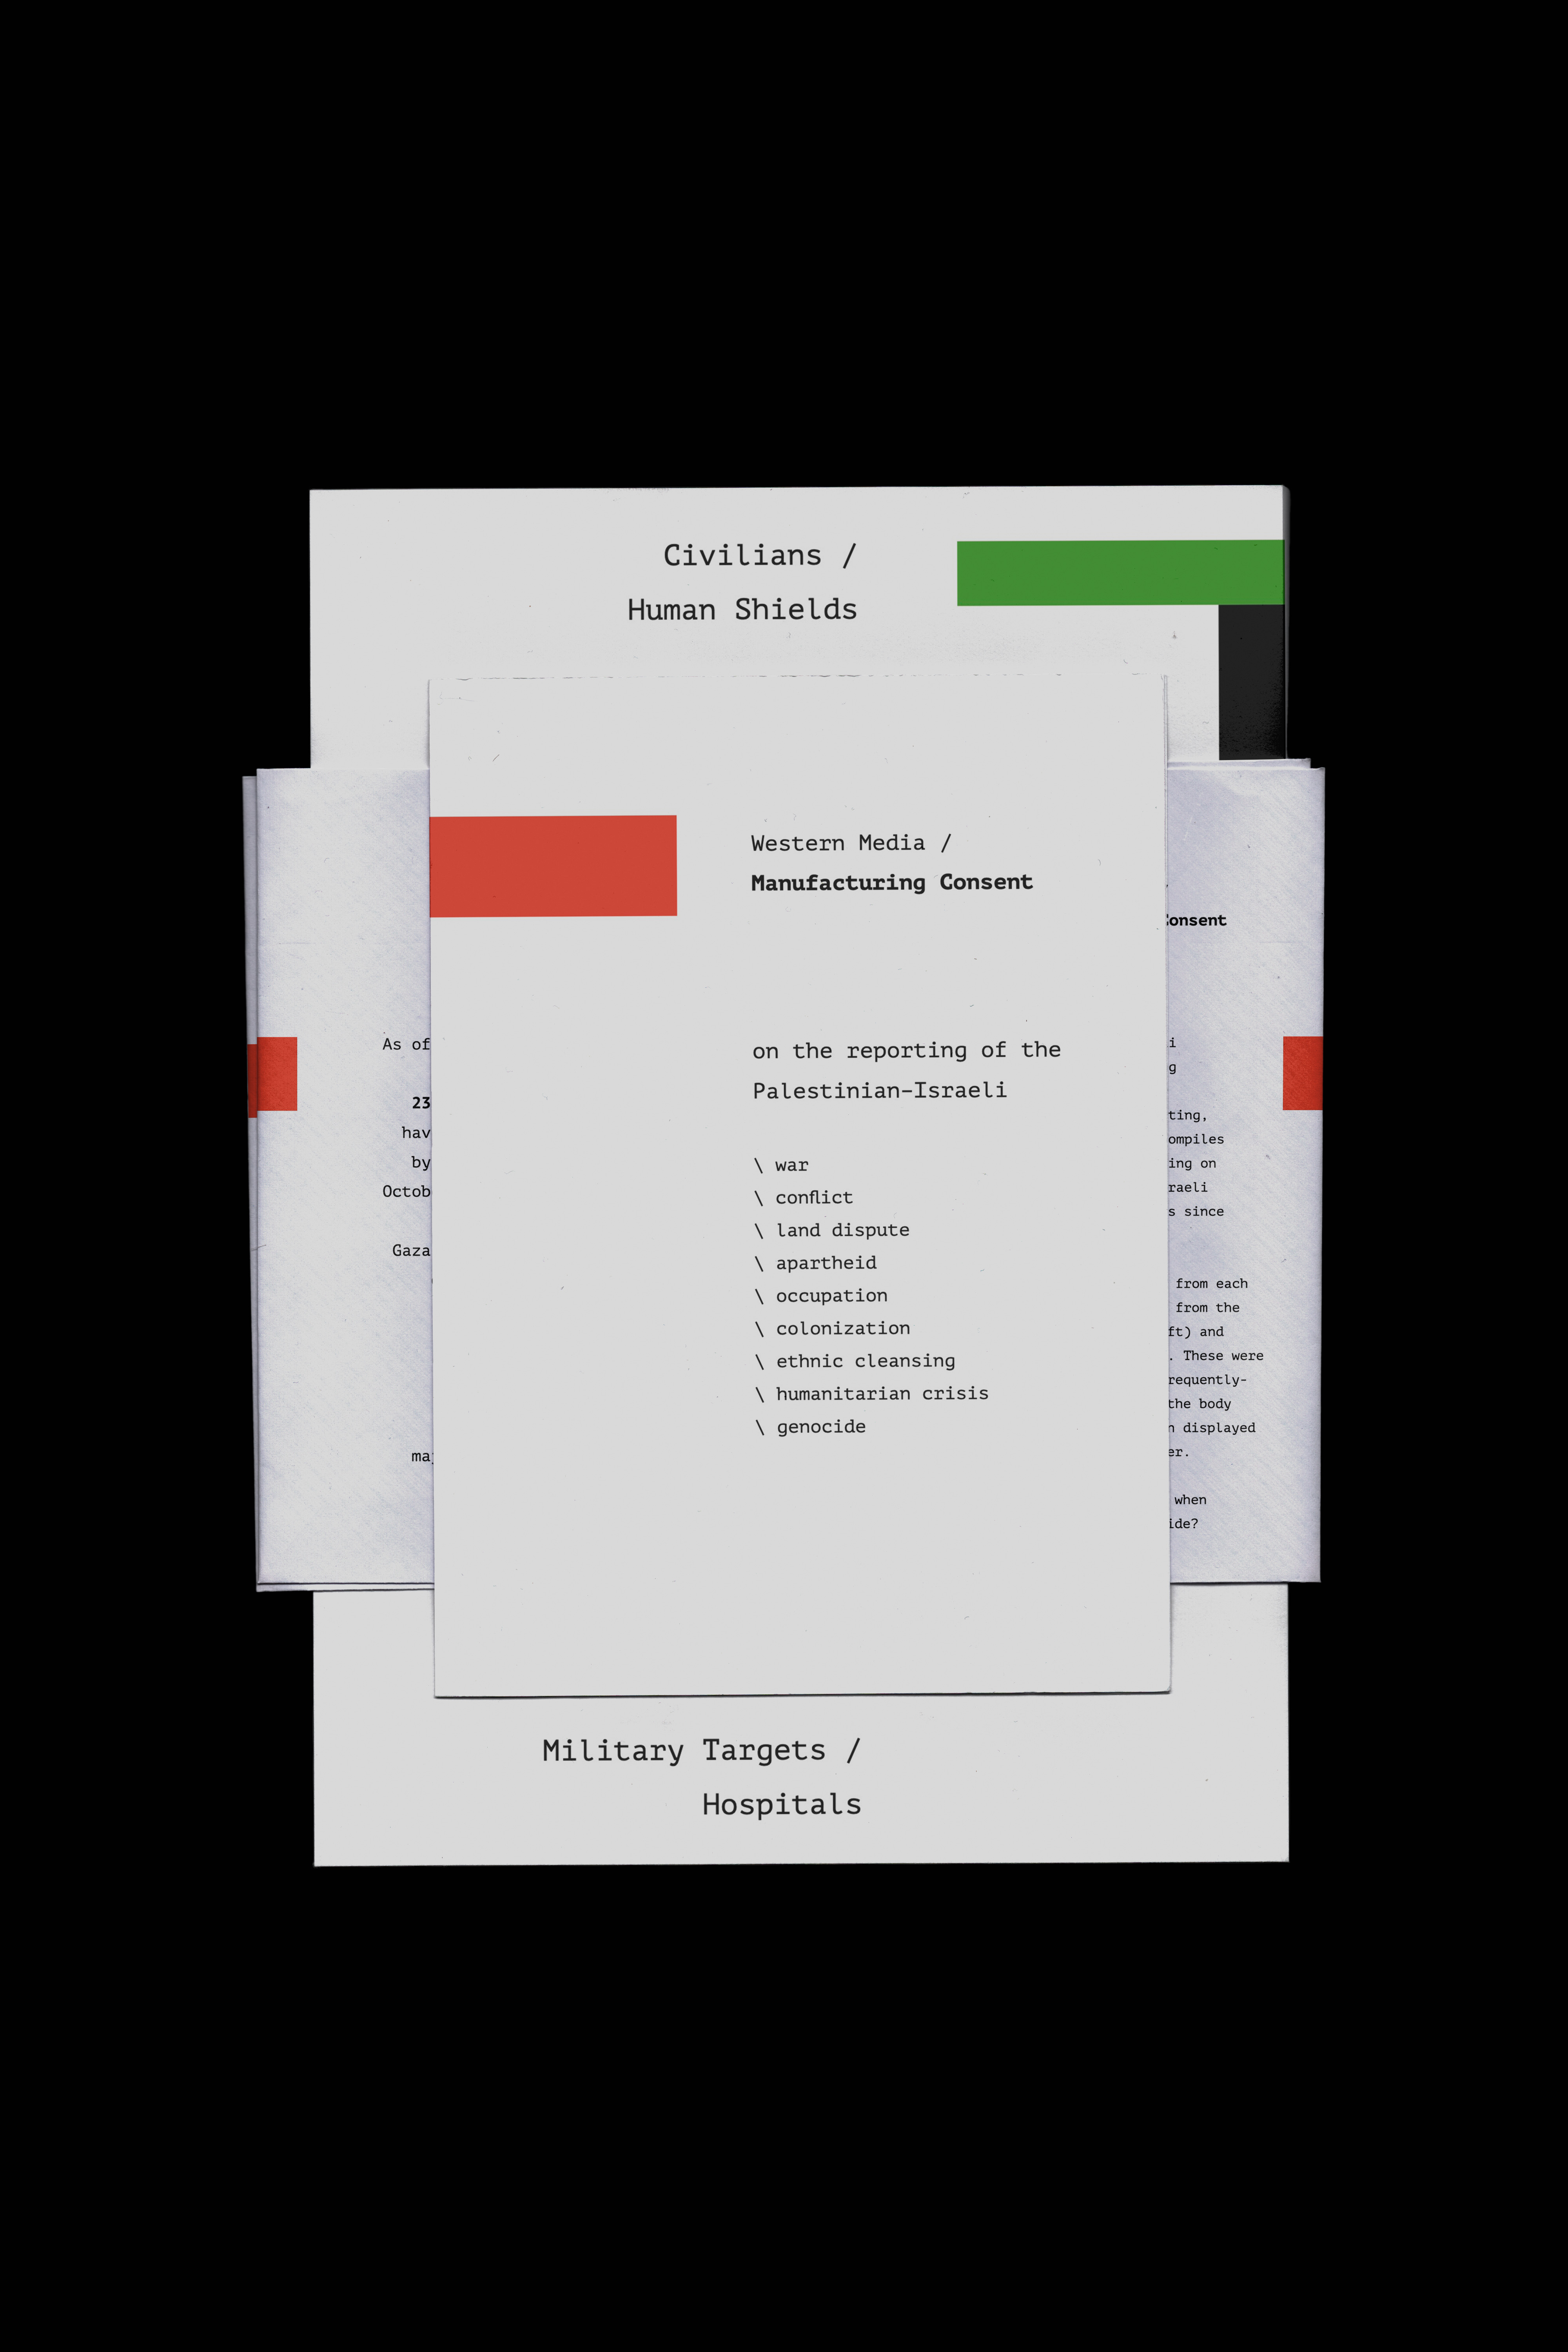
Graduates

Jess Hylek

MFA in Graphic Design - 2 Yr Path — Graduate Graphic Design
Course:
Generative Typography
Faculty:
Roy Tatum
Term:
2025 Spring

95 Weeks

Using AI and generative design, 95 Weeks processes 198 news articles on the Palestinian humanitarian crisis (October 7 2023–August 25 2025). Comparing The New York Times coverage with Al Jazeera, articles were resorted by word frequency, revealing how language shapes collective perception across media. The cover speaks to the conceptual core of the work, emphasizing the power of word choice and its influence in understanding.

Process:

Step 1: Research. I used Perplexity AI to identify the most-read article per week from both The New York Times and Al Jazeera across a span of 95 weeks from October 7, 2023 to August 25, 2025, and converting each article into a TXT file. Step 2: Word frequency analysis. I then ran each TXT file through a Processing sketch to extract word frequency data, exported as PDF files. Step 3: Generative design. I used Basil.js to automatically populate InDesign spreads with the resorted articles, producing a programmatically generated publication. Final design used physical clips to allow additional spreads to be continuously inserted as coverage continued.

Learning Outcomes:

This project deepened my understanding of how to turn quantitative data into a compelling visual form. I developed a workflow that integrated various AI and generative tools: using Perplexity for repeatable research; Processing for computational text analysis; and Basil.js to bridge data output into InDesign. I developed fluency in treating text as data and automating layout generation programmatically. 

By comparing The New York Times and Al Jazeera side-by-side, I gained firsthand insight into how word choice constructs narrative and shapes perception, discovering that the design process itself can be a tool for critical analysis. I found the value in an open-ended design system: the final clipped booklet (as opposed to a stitched, final artifact) was chosen to accommodate ongoing additions as coverage continued.

Tags:
Data Visualization,
Publication Design,
Research-Based Design,
Typography
Image
Step 1: Research
Compiling the articles: Perplexity AI > Most read article by week > TXT Files. Prompt: "Please provide the most read article from [insert publication name] from [insert date] to [insert date]." Which was then prompted for each week for each publication.
Image
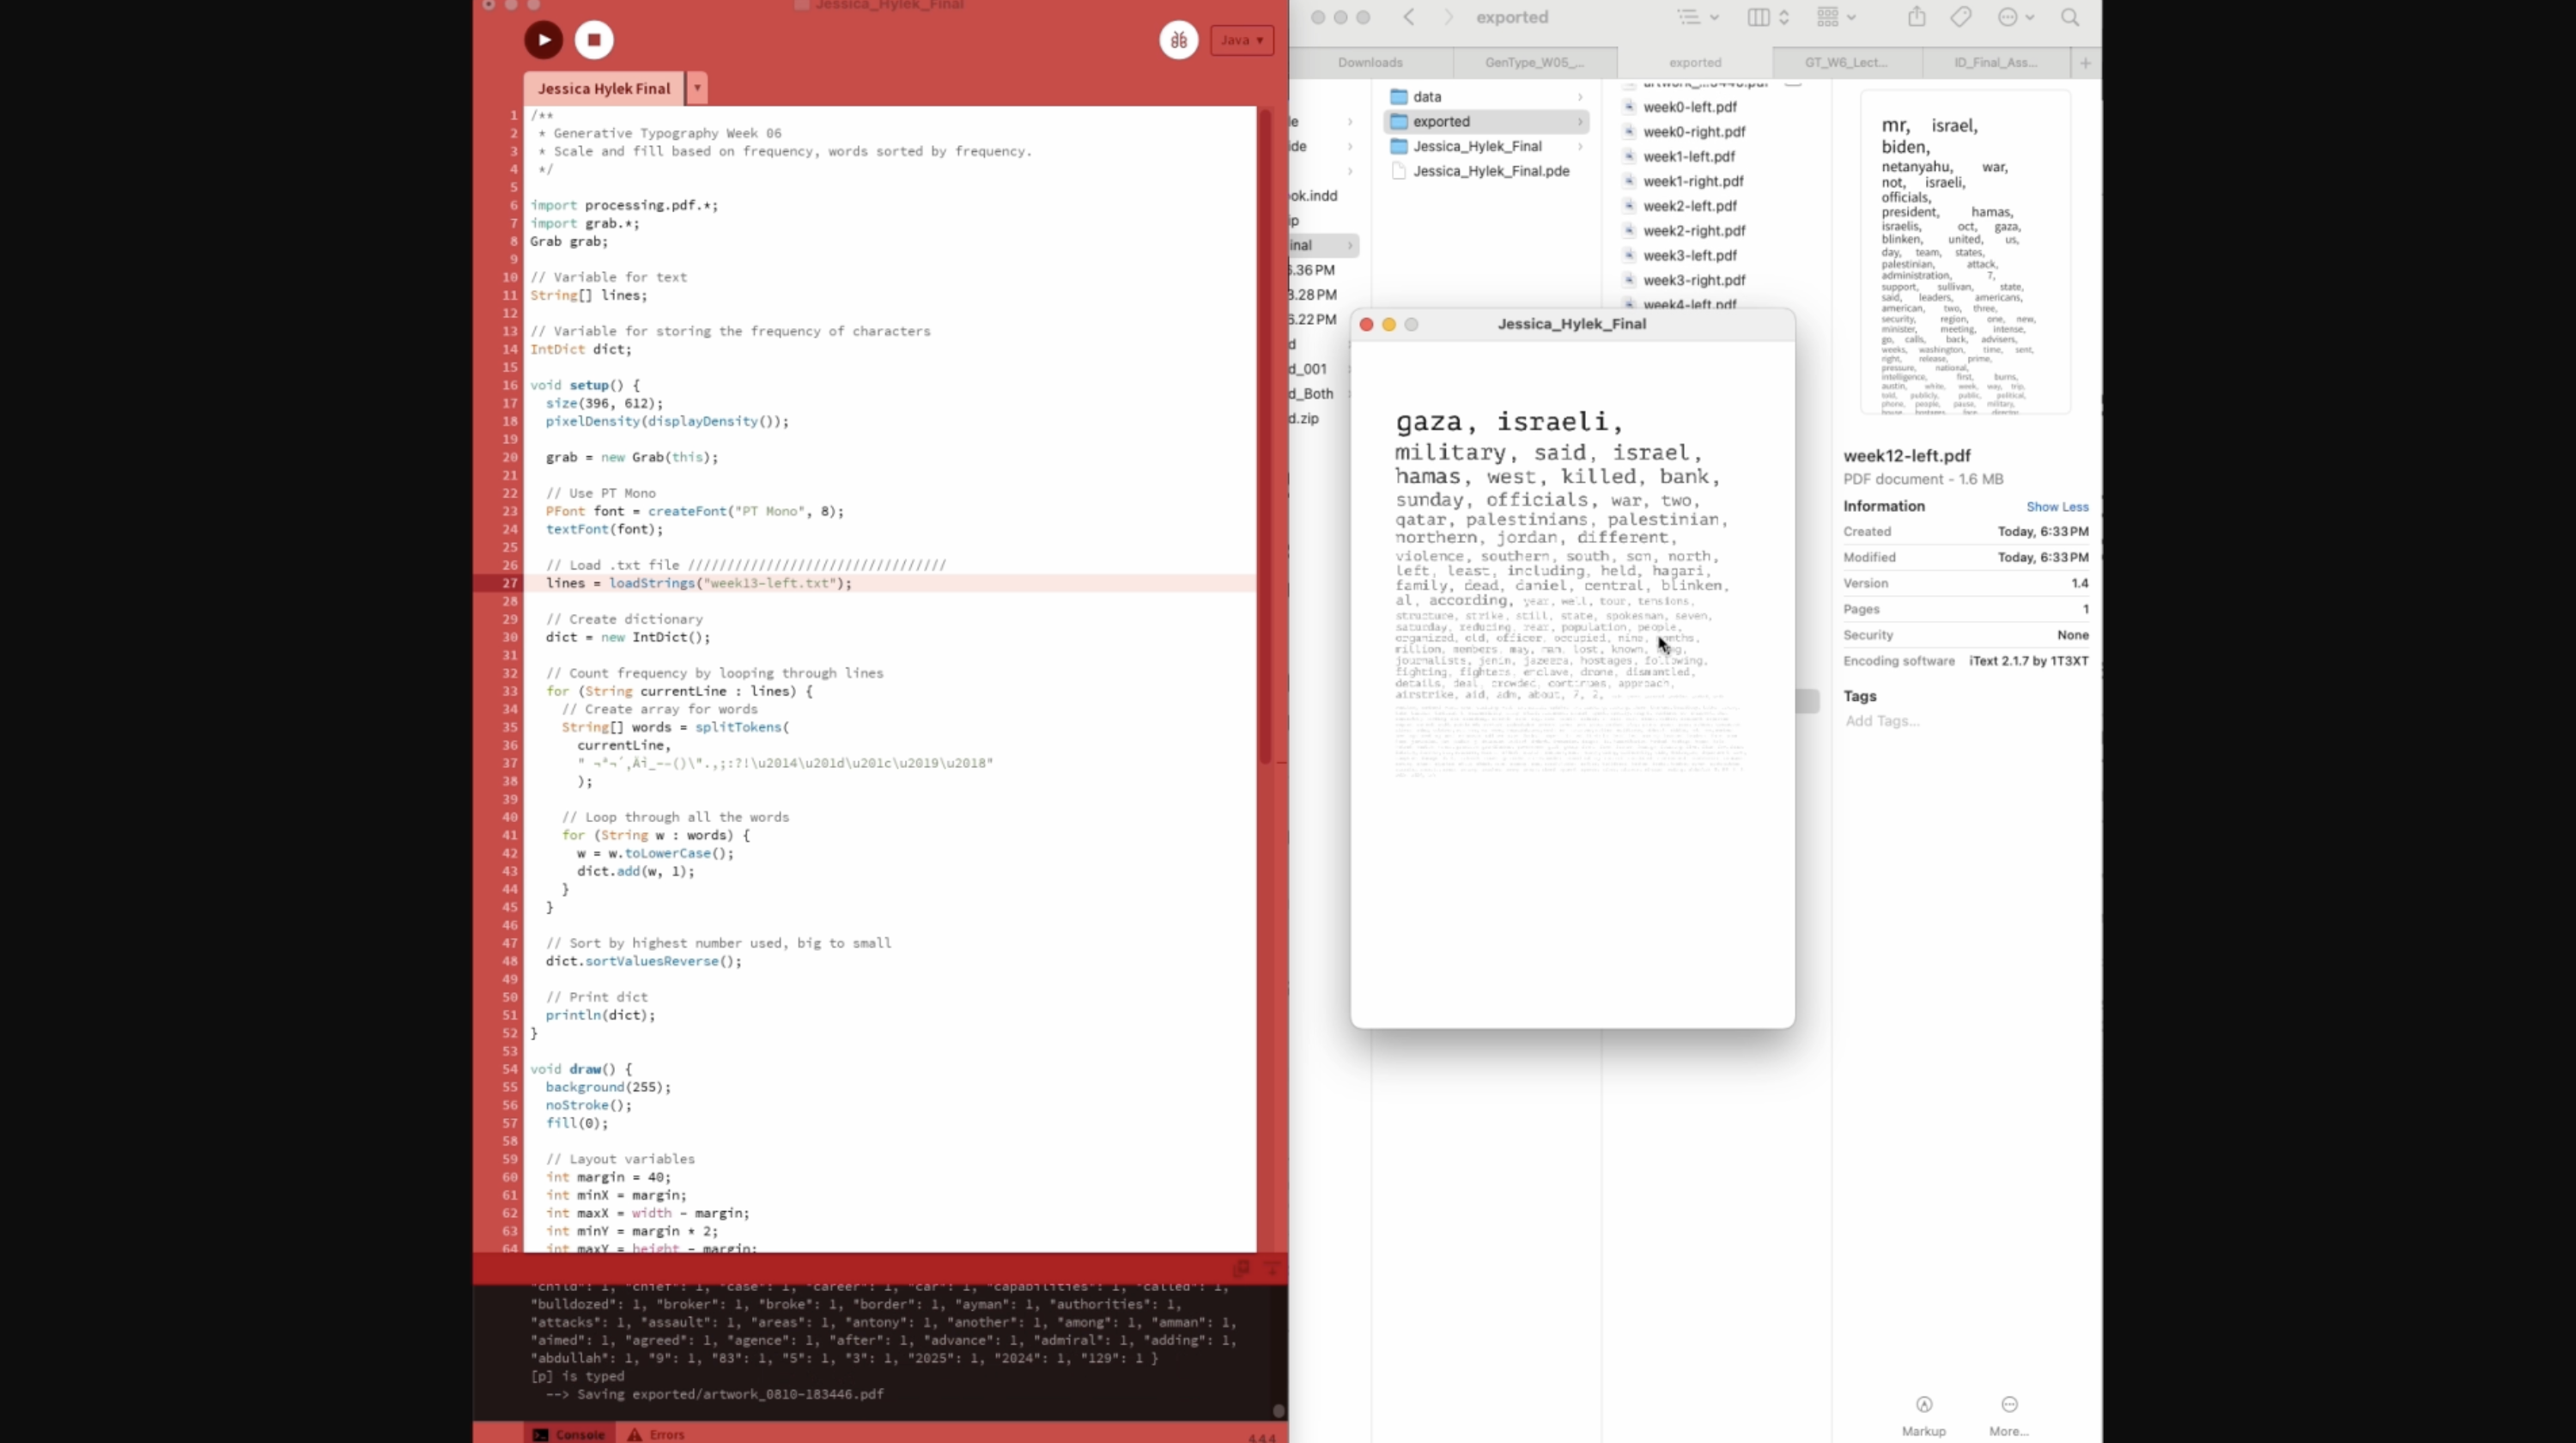
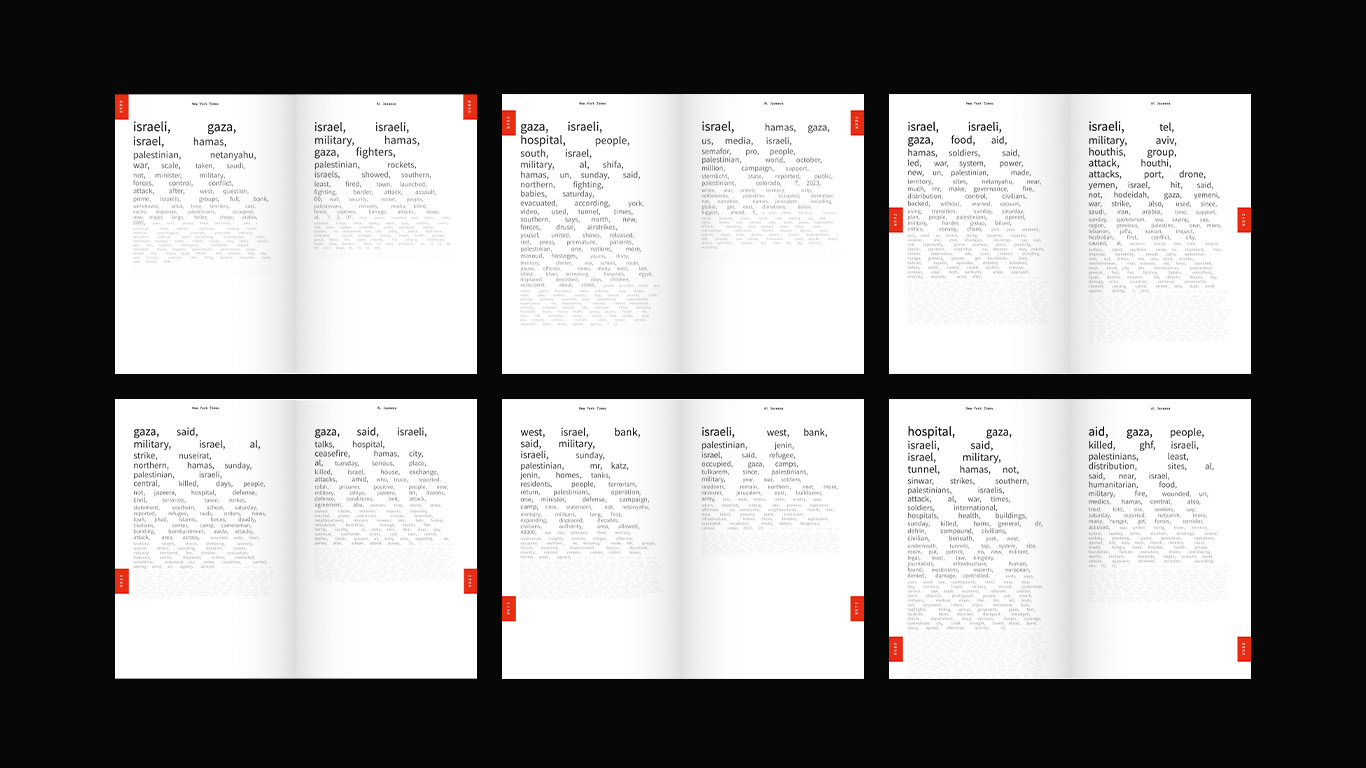
Step 2: Sorting by word frequency
Processing text as data: calling in the raw TXT file to Processing sketch > running through a word frequency code > then exporting as PDF files.
Image
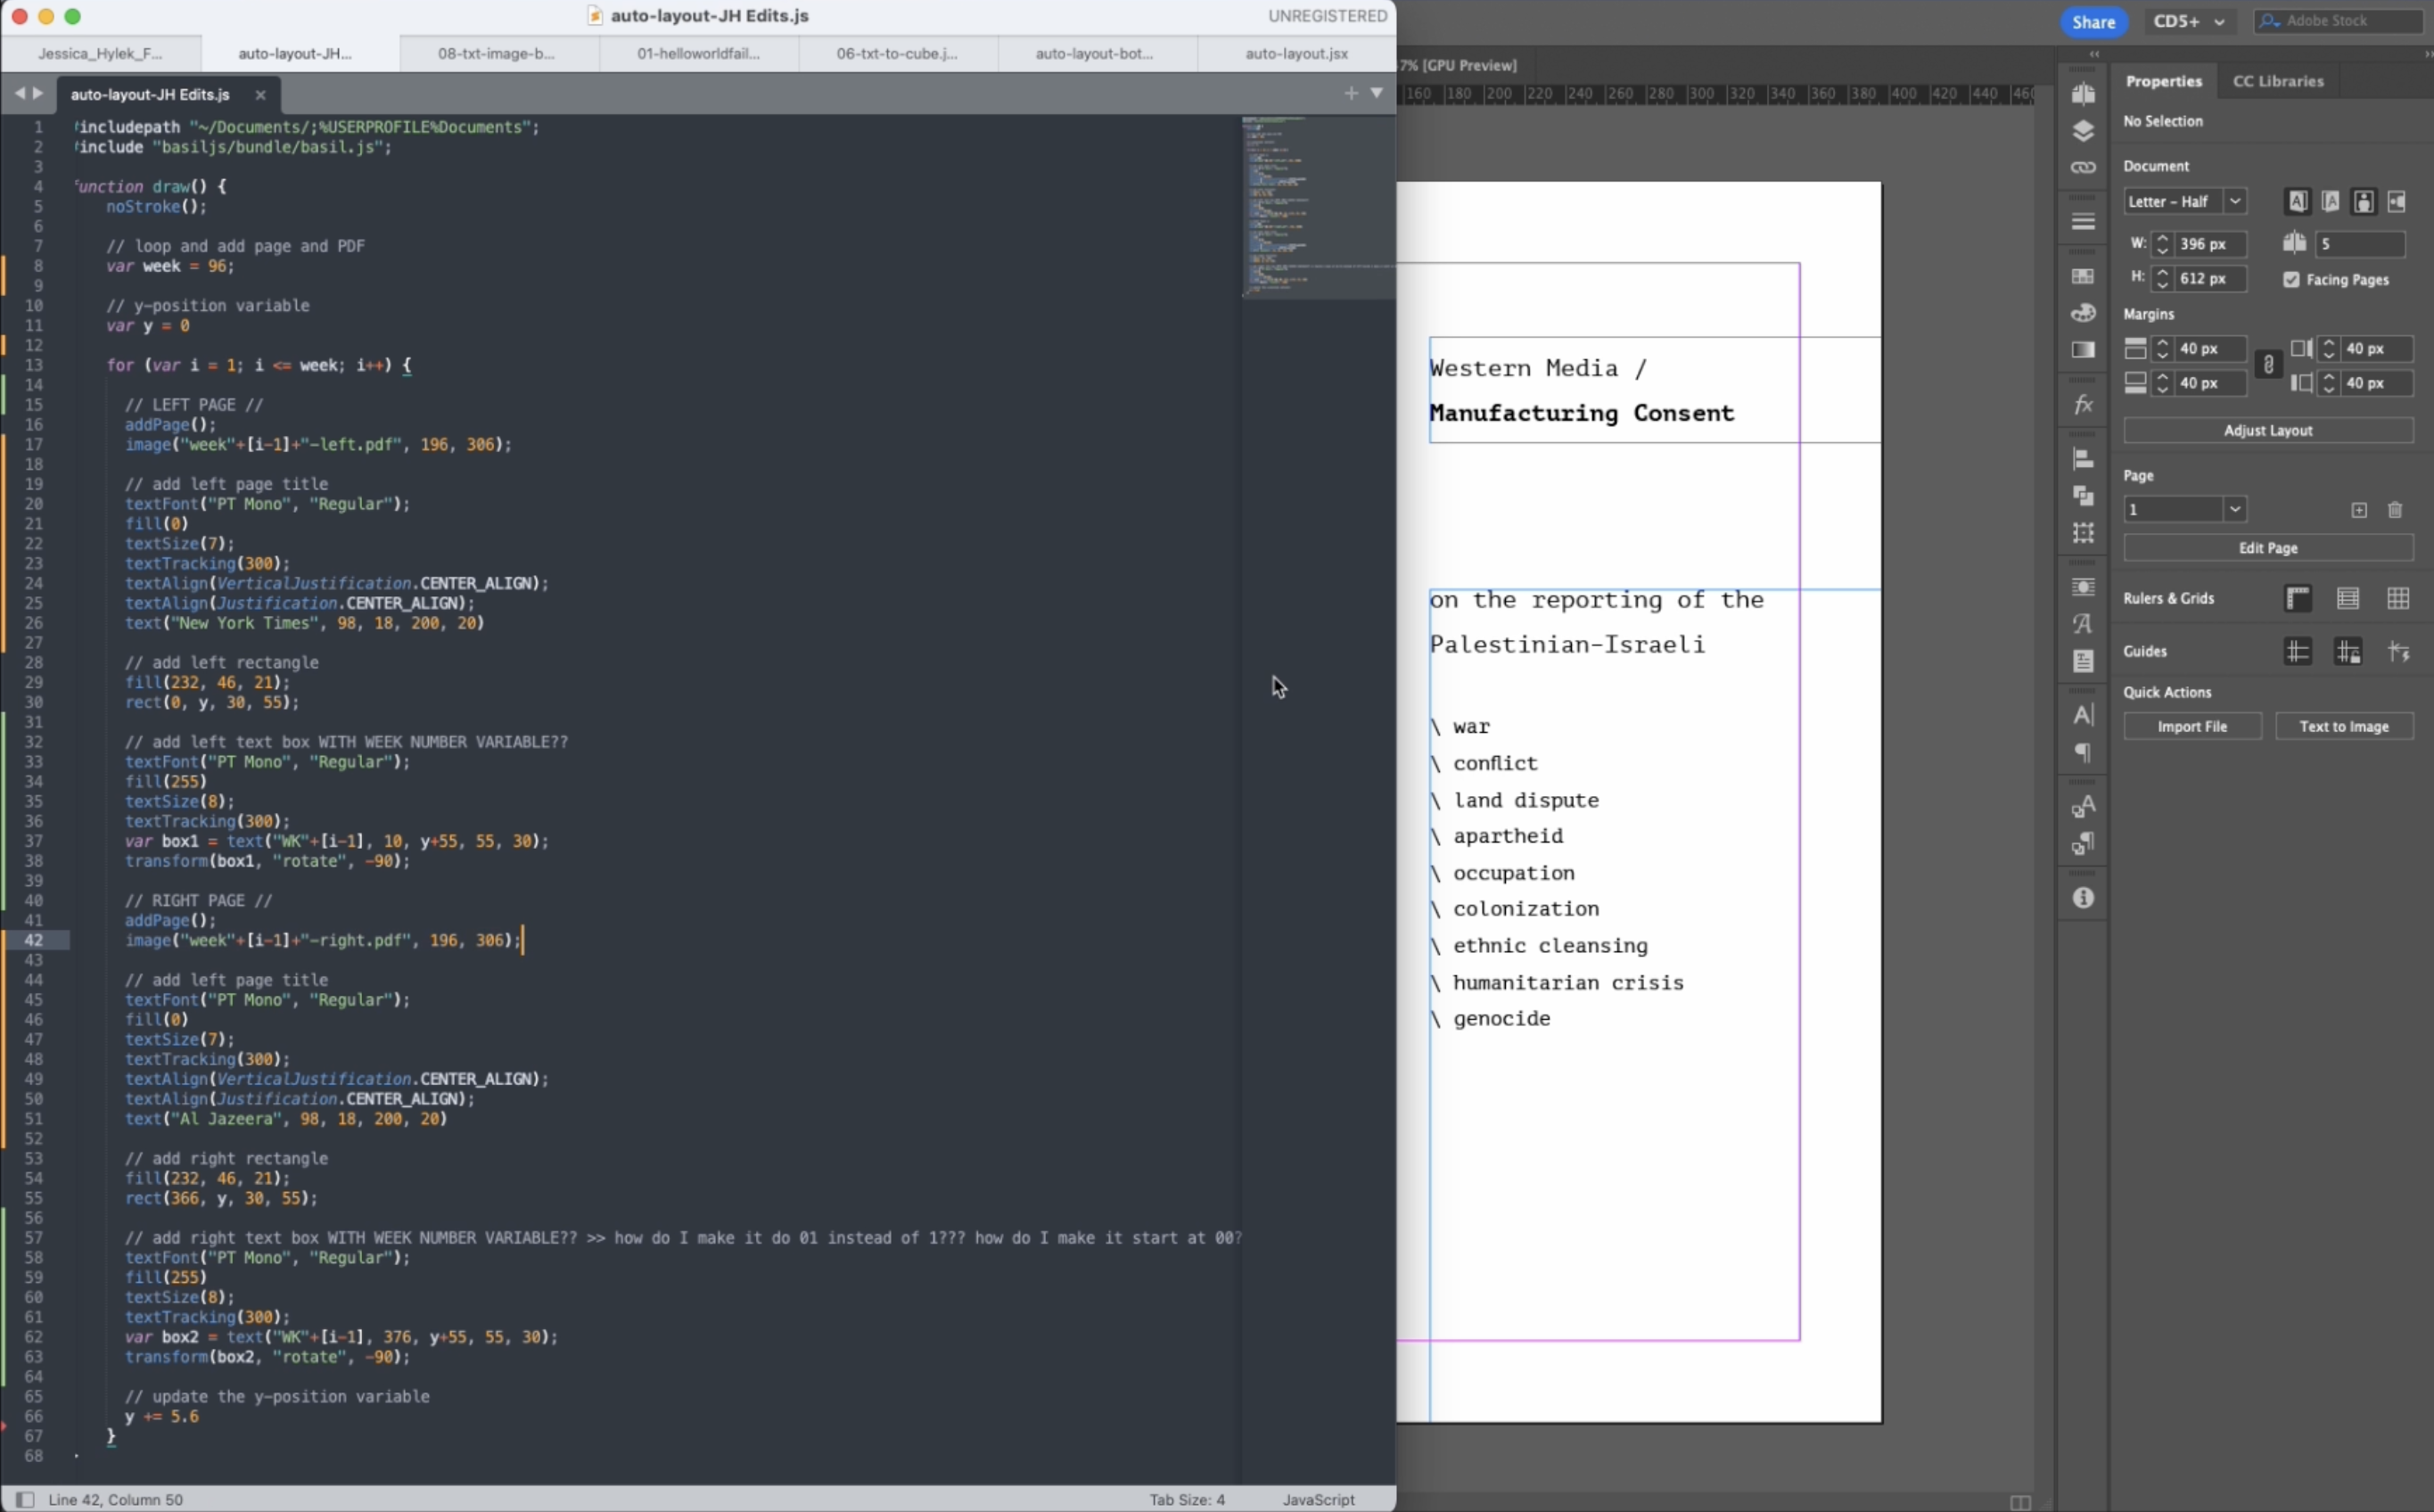
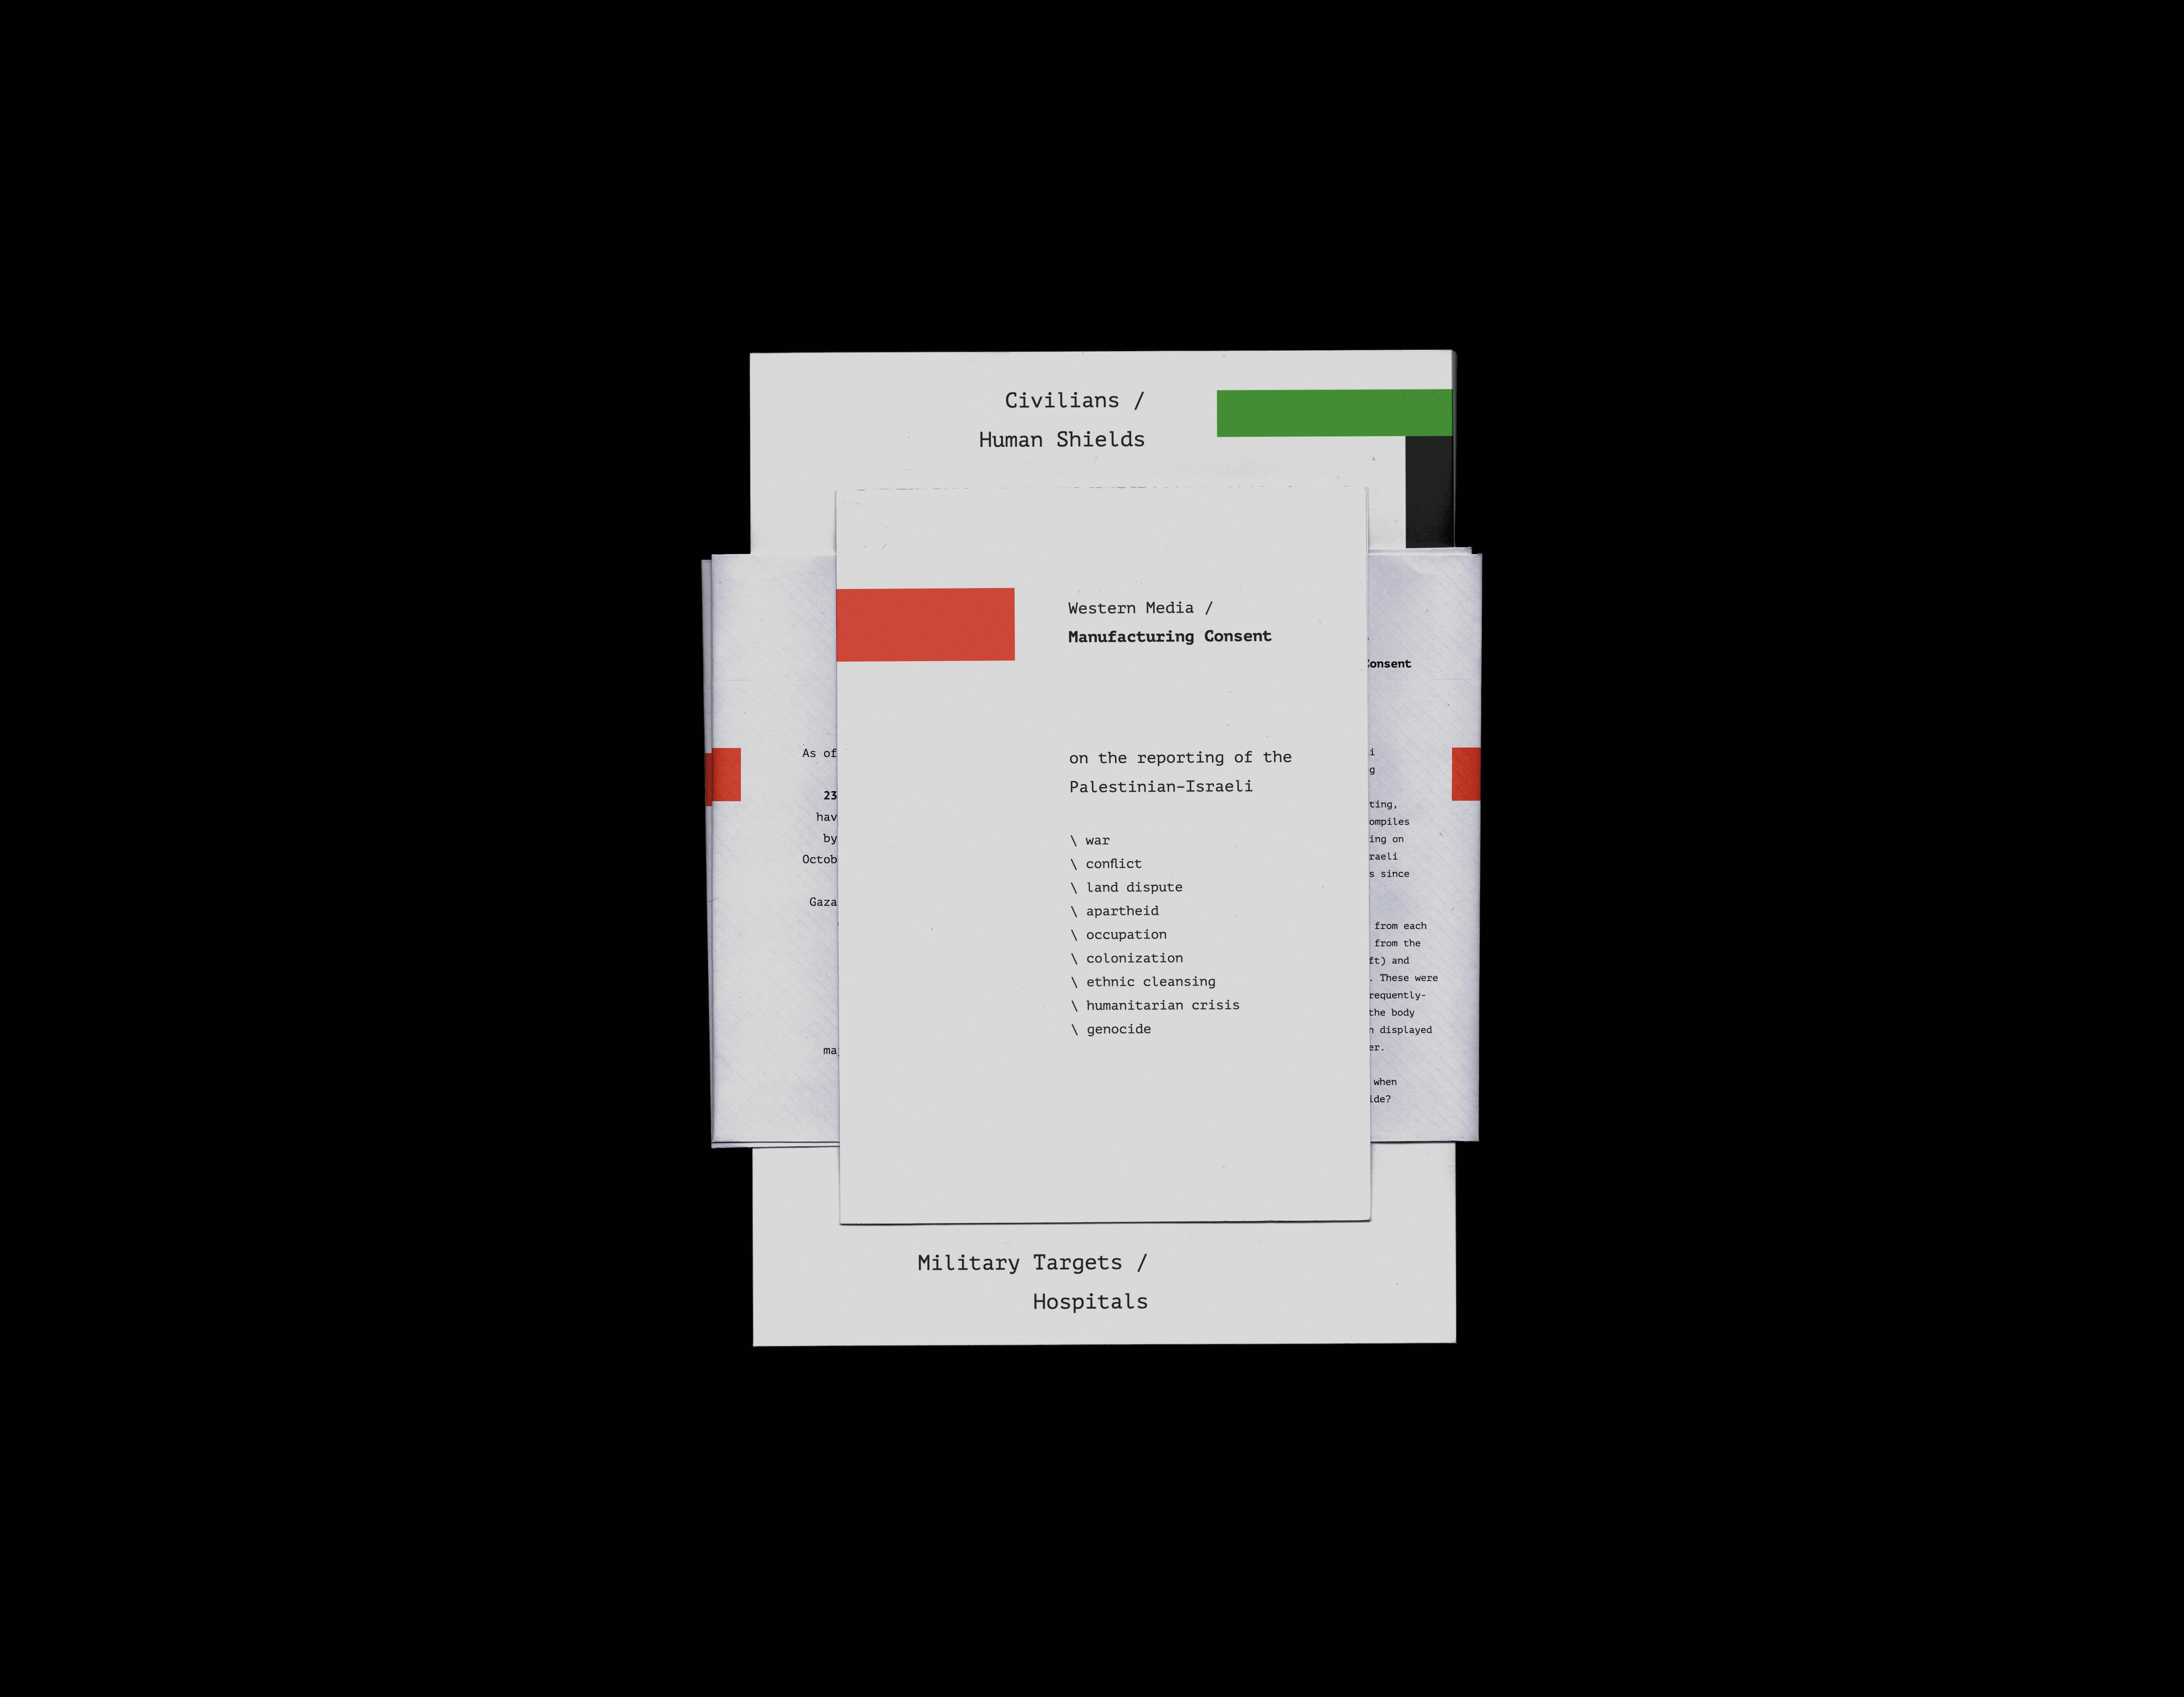
Step 3: Generating design
Using programmatic software to automatically populate the pages: Basil.js > InDesign.
Image
Image
Image
Image